
Call and Text Usage on the Dashboard
Overview
Foundation's dashboard tracks every in-app call and text your team sends or receives. The # of Calls and # of Texts widgets show you how much outreach is actually happening, how often leads pick up, and how long your team spends on the phone — without pulling a single report.
Understanding the call and text widgets
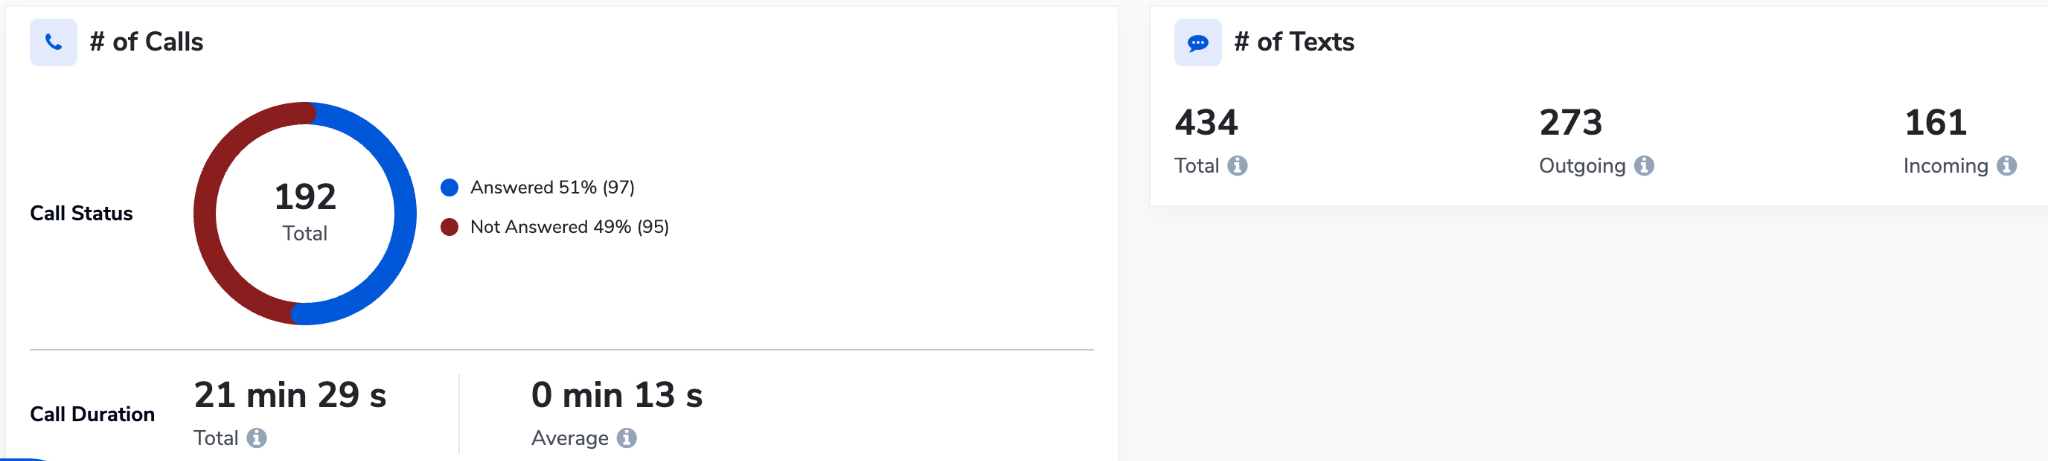
The # of Calls widget breaks down your call activity two ways. Call Status is a donut chart showing your total call volume, split into answered and not answered, with both the percentage and the raw count for each. Call Duration shows total talk time across all calls plus the average length of a single call.
The # of Texts widget shows your total message volume, then splits it into Outgoing (messages your team sent) and Incoming (replies from leads). Comparing the two is a quick read on how well your messaging is landing.
💡 Tip: A low answered percentage usually means you could need to change your outreach approach.
How to view your call and text usage
- Go to Dashboard in the left navigation.
- Select your study from the study selector.
- Scroll down past the top-level metrics to reach the # of Calls and # of Texts widgets.
- Narrow the view using the filters at the top of the dashboard. Use the site filter to see usage for a single site, and the date filter to limit the numbers to a specific time period. Both widgets update to match your selection.
These widgets only appear if engagement features are enabled for your study. If you don't see them, see How do I get engagement features enabled in my study? (https://support.buildclinical.com/article/341-how-do-i-get-engagement-features-enabled-in-my-study)